Thermal Comfort: Understanding Metrics and Tools
Thermal comfort is a fundamental aspect for people’s well-being in both indoor and outdoor environments. Understanding and assessing thermal comfort conditions is essential in building design, urban planning, and various other areas, and in this article, we will explore some metrics and tools used to analyze and design thermal comfort.
Most used Thermal Comfort Guidelines
European Standard for Indoor Environment Parameters (EN 15251)
EN 15251, also known as “Building Design – Thermal Comfort Parameters”, is a European standard that establishes the requirements for thermal comfort in buildings. This standard takes into consideration factors such as temperature, humidity, air speed, thermal radiation, and clothing. It provides reference values for these parameters, with the aim of ensuring a comfortable environment for occupants.
It is important to note that compliance with EN 15251 is voluntary, but its application is highly recommended. Architects, engineers, and construction professionals can make use of this standard as a valuable reference for designing and maintaining comfortable and healthy indoor environments. By following the guidelines set out by EN 15251, it is possible to create spaces that promote the well-being and satisfaction of building users.
Visit the official CEN website to consult and download the EN 15251 in this link.
ASHRAE 55: Establishing thermal comfort criteria for indoor environments
ASHRAE 55, in turn, is a standard developed by the American Society of Heating, Refrigerating and Air-Conditioning Engineers (ASHRAE). This standard establishes the thermal comfort criteria for artificially conditioned environments in the United States. ASHRAE 55 takes into account factors such as temperature, relative humidity, air speed, and thermal radiation, but also includes psychological parameters, such as adaptive preference. In addition, the standard offers different approaches for different types of occupation, such as offices, homes, and schools.
Visit the Official ASHRAE website for information about the ASHRAE 55 standard, including access to relevant documents and publications. You can also download the standard via this link.
ISO 7730 – International Standard for Thermal Comfort in Environments
ISO 7730 is an international standard that defines thermal comfort criteria for indoor environments. This standard is fundamental because it establishes calculation methods for PMV (Predicted Mean Vote) and PPD (Predicted Percentage of Dissatisfied), providing detailed mathematical formulas and procedures for their application. While ASHRAE 55 also mentions these metrics, ISO 7730 distinguishes itself by offering a more comprehensive and universal approach to their implementation, with specific tables and technical annexes that facilitate its application in different global contexts. The standard takes into account factors such as air temperature, relative humidity, air velocity, and thermal radiation, establishing recommended limits and ranges for each of these parameters, considering the activities carried out in the environment and people’s needs.
Visit the Official ISO website and search for the standard number (ISO 7730) to access information about the standard and you can download it in this link.
Although these guidelines have similarities in relation to the factors considered for thermal comfort, they may differ in terms of specific values and limits established for each parameter. It is important to consult each standard for detailed information on their differences and specific applicability.
Indoor Thermal Comfort Metrics
Adaptive Thermal Comfort
Adaptive Thermal Comfort is a model that recognizes people’s ability to adapt to and prefer a wider range of thermal conditions. Unlike traditional metrics, Adaptive Thermal Comfort takes into account factors such as clothing, physical activity, and individual expectations. This model gives people the ability to customize their comfort experience in different environments and weather conditions.
The Adaptive Thermal Comfort metric relates indoor design temperatures with outdoor temperatures. It is based on the understanding that occupants can adapt to, or even prefer, a wider range of thermal conditions. For example, the acceptability criteria under this metric allow for warmer indoor conditions (outside the typical 21ºC to 24ºC criteria range) when the outdoor conditions are very hot.
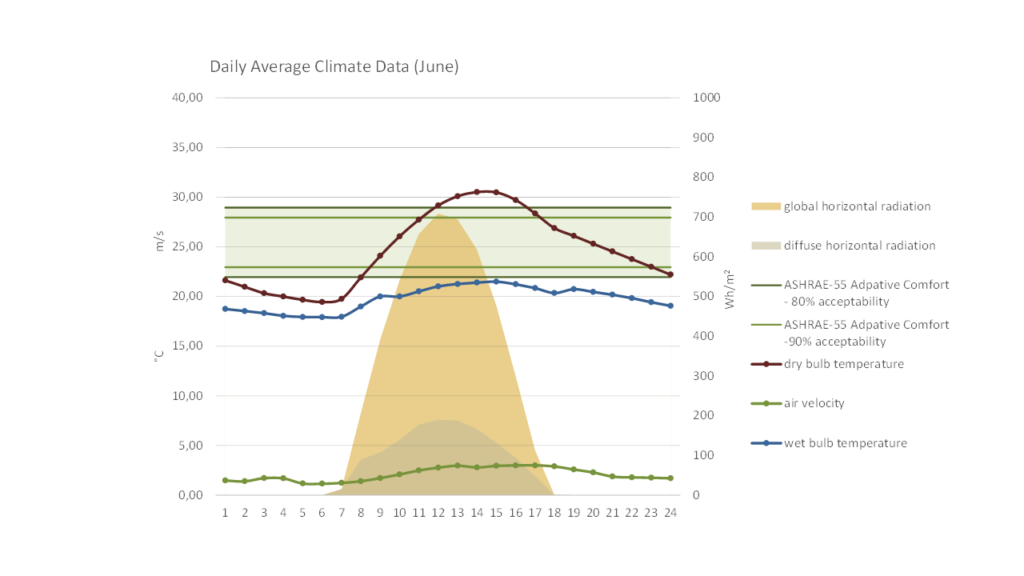
The Adaptive Thermal Comfort model can be used if the following conditions are met (according to Section 5.4 of the ANSI/ASHRAE 55 Standard):
- The space is naturally conditioned/ventilated by occupant control;
- The space does not have a mechanical cooling system (mechanical ventilation with unconditioned air is permitted);
- There is no heating system in operation in the space (heating systems can be provided, but the adaptive method does not apply when in operation);
- The occupants in the space are engaged in nearly sedentary physical activities (i.e., in a seated or standing position);
- The occupants are free to adapt their clothing to indoor and outdoor thermal conditions within a range of at least 0.5 to 1.0 clo (clo is a unit used to express the thermal insulation provided by clothing); and
- The prevailing outdoor mean temperature is greater than 10°C and less than 33.5°C.
To achieve a comfort level, an acceptability limit of more than 80% must be achieved in 95% of the useful area during 98% of the operating hours (calculated according to the ANSI/ASHRAE 55 standard). It should be noted that the 80% acceptability limit is related to the indoor operative temperature (operative temperature refers to the level of human comfort due to air temperature, mean radiant temperature, and air speed).
Predicted Mean Vote
The Predicted Mean Vote (PMV) is a method created by Fanger (1970), widely used to evaluate and quantify the perceived thermal sensation in environments. The metric was designed for fully mechanically ventilated buildings and is determined according to the ANSI/ASHRAE 55 standard.
This standard establishes a range of thermal conditions considered acceptable for different environments and activities. Through a 7-point thermal sensation scale ranging from -3 (cold) to +3 (hot), with 0 being neutral, where thermal comfort is found.
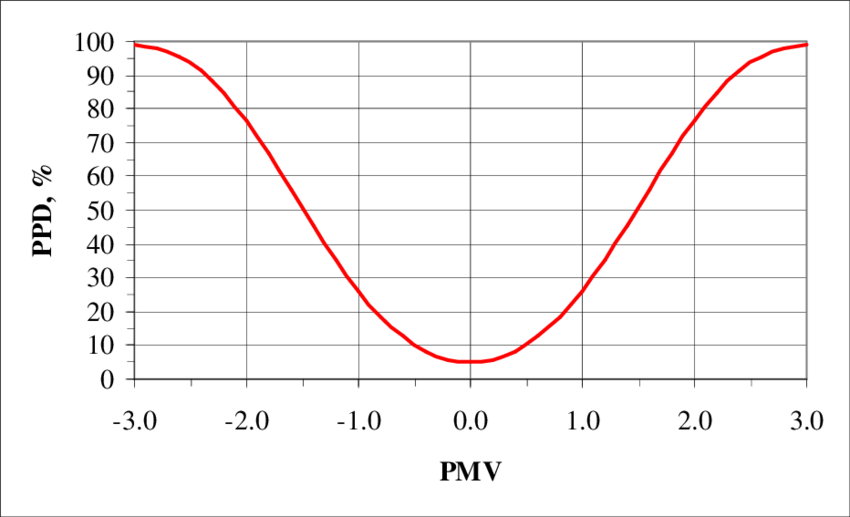
The PMV takes into account several factors to determine the level of thermal comfort. These factors include air temperature, relative humidity, air speed, and the metabolic rate of people in the environment.
By applying the Predicted Mean Vote method, it is possible to obtain a result that indicates whether the thermal conditions are considered cold, comfortable, or hot. This evaluation is extremely useful for architecture and engineering projects, as it allows for the analysis and optimization of the thermal comfort of spaces, ensuring the well-being of the people who use them.
Predicted Percentage of Dissatisfied (PPD)
PPD (Predicted Percentage of Dissatisfied) is another indicator created by Fanger (1970), used to evaluate thermal comfort in indoor environments. While the PMV predicts the thermal sensation, the PPD considers the level of satisfaction of occupants in a space, representing the percentage of people who are likely to be dissatisfied with the thermal conditions of the environment.
The PPD takes into account factors such as air temperature, relative humidity, air speed, clothing worn, and physical activity. Based on these variables, it is possible to estimate the probability of thermal discomfort for different ranges of temperature and humidity.
It is important to note that the PPD is only an estimate and can vary according to the individual characteristics of each person. In addition, thermal comfort can also be influenced by other factors, such as personal preferences and gradual adaptation to environmental conditions.
Universal Thermal Comfort Index (UTCI)
The Universal Thermal Comfort Index (UTCI) is a bioclimatic model that seeks to establish a comprehensive index of outdoor thermal comfort. It takes into account various factors, such as air temperature, humidity, air speed, and solar radiation. In addition, the UTCI was developed to be applicable in different regions and climates, providing a universal standard of thermal comfort.
The UTCI index is categorized into 10 thermal stress categories, ranging from extreme heat stress (above +46°C) to extreme cold stress (below -40°C).
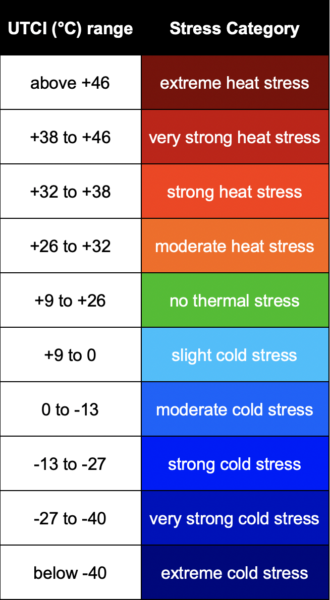
- Above +46: Extremely hot. Extremely hot and dangerous conditions.
- +38 to +46: Very hot. Very hot and uncomfortable conditions.
- +32 to +38: Hot. Hot conditions, but still bearable.
- +26 to +32: Moderate heat
- 0 to +9: Cool. Moderately cold conditions, but generally comfortable.
- 13 to 0: Moderate cold
- 27 to -13: Very cold conditions, but still tolerable.
- 40 to -27: Very Cold
- Below -40: Extremely cold and uncomfortable conditions.
These numbers represent the human perception of thermal comfort based on factors such as temperature, humidity, air speed, and thermal radiation. It is important to consider these metrics when designing comfortable environments for people.
Heat Index
The Heat Index, also known as Heat Index in English, is a meteorological indicator that combines air temperature and relative humidity to determine how environmental conditions are perceived by the human body. This index is particularly important in regions with hot and humid climates, where humidity can intensify the sensation of thermal discomfort. Therefore, it is crucial to monitor the Heat Index to ensure the safety and well-being of people exposed to these adverse weather conditions.
When analyzing the Heat Index, it is important to note that it takes into account the interaction between temperature and relative humidity. This is because humidity affects the body’s ability to cool itself through perspiration, which can lead to an increased risk of heat-related problems, such as heatstroke and heat exhaustion. Therefore, the Heat Index provides a more accurate and comprehensive measure of thermal discomfort, taking into account not only air temperature but also the humidity present in the environment.
The Heat Index calculates different heat index levels, which can be used to assess the risk of discomfort and heat-related problems. Here are the heat index levels that the Heat Index presents:
- From 27°C to 32°C: Caution. No significant thermal discomfort.
- From 32°C to 41°C: Extreme Caution. Possible thermal discomfort, especially with prolonged exposure and intense physical activity.
- From 41°C to 54°C: Danger. High risk of thermal discomfort, intense physical activity can lead to heat exhaustion.
- Above 54°C: Extreme Danger. Extreme risk of thermal discomfort, prolonged exposure can lead to heat stroke and life-threatening risk.
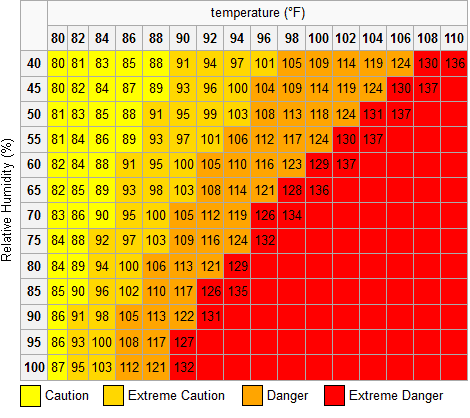
It is important to be aware of these heat index levels when monitoring the Heat Index and taking appropriate measures to protect health and well-being during hot and humid weather conditions.
In addition, it is important to note that the Heat Index is not only useful information for individuals, but also for professionals working in outdoor environments, such as construction, agriculture, and outdoor sports. These people need to be aware of the Heat Index to adopt appropriate protection and prevention measures against the negative effects of excessive heat.
There are several websites and software available to simulate the Heat Index. Some of the most popular include:
- Omni Calculator: The website offers a “Heat Sensation” section where you can enter the temperature and relative humidity to calculate the Heat Index.
- National Weather Service: The United States’ national weather service also provides an online Heat Index calculator on its website.
Tools for Thermal Comfort Analysis
Psychrometric Chart
The use of the psychrometric chart is an extremely useful and relevant tool for bioclimatic simulations aimed at thermal comfort in built environments. It allows for a detailed analysis of the conditions of temperature and relative humidity of the air, providing accurate information to determine the comfort index in a given space.
By using the psychrometric chart, it is possible to graphically visualize the relationship between temperature and air humidity, which allows for a clearer understanding of climatic conditions. This is especially important for the design of sustainable and efficient buildings, as it allows for informed decisions in the pursuit of occupant thermal comfort, while seeking to reduce energy consumption.
In addition, the psychrometric chart also assists in optimizing the use of air conditioning systems, as it is possible to identify the ranges of temperature and humidity in which people will feel most comfortable. In this way, it is possible to correctly size the cooling or heating systems, avoiding energy waste and ensuring the well-being of users.
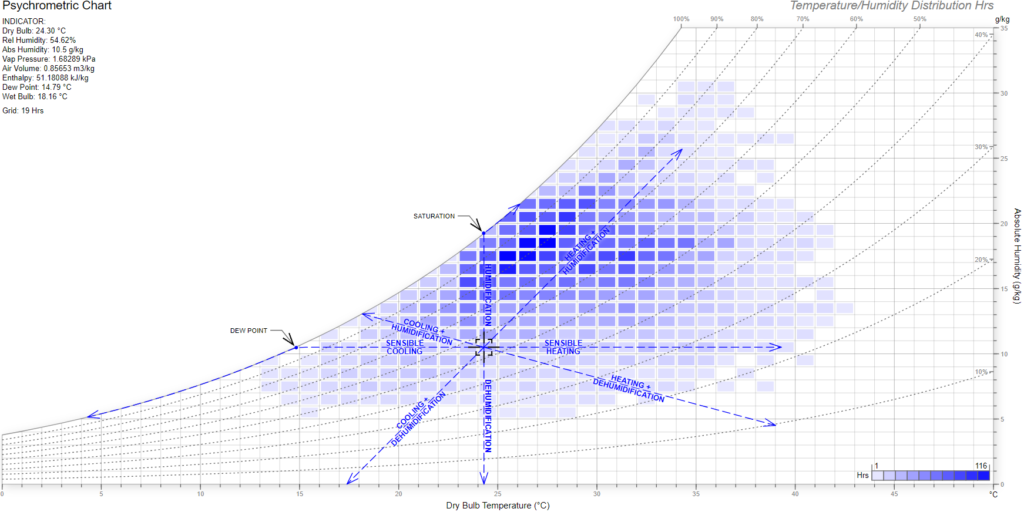
To read the psychrometric chart, you can follow these simple steps:
- Identify the dry temperature (or air temperature) on the horizontal axis of the chart.
- Locate the relative humidity on the vertical axis of the chart.
- Draw a straight line from the dry temperature to the curve corresponding to the relative humidity.
- The intersection between the drawn line and the curve indicates the wet bulb temperature (or dew point temperature).
- From the wet bulb temperature, it is possible to determine other properties, such as specific enthalpy or specific volume.
You can simulate the psychrometric chart on various websites and software. I really like the Andrew Marsh website, which even gives you the option to view the thermal comfort metrics overlaying the psychrometric chart according to the climate you are studying.
The available metrics for overlay are:
- Heat Index
- Predicted Mean Vote (PMV) according to ISO 7730:2005, ASHRAE 55:2007, and EN 15251:2007 standards.
- Givoni Bioclimatic Chart
About Givoni’s bioclimatic chart, it is a tool used to assess and understand the climatic conditions of a certain region and how they can influence the conception and design of buildings. It takes into account factors such as temperature, humidity, wind, and solar radiation to determine the climatic characteristics of a place.
This table is applied in the field of architecture and building design to assist in creating comfortable and energy-efficient spaces. It allows identifying project strategies, such as the use of suitable materials, solar orientation, natural ventilation, and thermal insulation, which can improve the performance of buildings in different climates. Based on the table data, it is possible to identify project strategies that can improve building performance. For example, if the table indicates high temperatures and intense solar radiation during some season, strategies such as the use of shading and thermal insulation can be considered.
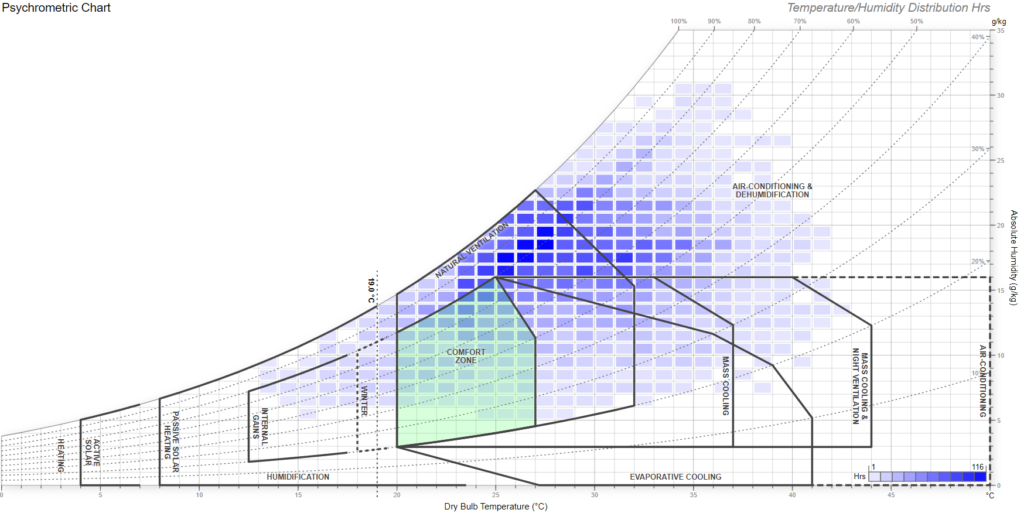
It is essential to remember that Givoni’s bioclimatic table is just a preliminary tool. For a complete and detailed project, it is necessary to carry out more in-depth analyses and additional studies, such as computational simulations and energy performance analyses.
Therefore, the use of the psychrometric chart is essential to ensure thermal comfort in built environments, contributing to the creation of more sustainable, efficient, and pleasant buildings to live or work in.
Computational Simulation Softwares
There are several software available to perform simulations and thermal comfort analyses. Some popular examples include:
- Ladybug Tools: A plugin for Grasshopper, a visual programming language in Rhino 3D that allows the simulation of thermal comfort and energy analysis in buildings.
- Thermal Comfort Tool: An online tool that allows evaluating thermal comfort based on PMV and PPD.
- ENVI-met: A microclimate simulation software that can be used to analyze the thermal environment and simulate the UTCI.
- Climate Studio: A climatic simulation software used to analyze the thermal environment and conduct UTCI and thermal comfort simulations.
- IES: The IES is an environmental simulation software that can also be used to analyze the thermal environment and perform UTCI simulations. It offers advanced features for building modeling and thermal comfort evaluation.
- EnergyPlus: It is an environmental simulation software used for thermal environment analysis and advanced features for building modeling and thermal comfort evaluation.
- DesignBuilder: It is a climatic simulation software that can be used for thermal environment analysis and offers advanced features for modeling indoor and outdoor environments, allowing a detailed analysis of thermal comfort.
These are just a few available options, and each software has specific characteristics and requirements. It is important to check the documentation and features of each tool to choose the one that best meets your needs.
Conclusion
Thermal comfort is an essential factor for the well-being and productivity of people in indoor and outdoor environments. With the help of suitable metrics and tools, it is possible to analyze, design, and optimize the conditions of thermal comfort in different spaces and climates. Therefore, when considering projects in architecture, urban planning, and other related areas, it is essential to incorporate the study and analysis of thermal comfort from the initial stages.
Remember that each metric and tool has its characteristics and limitations, and it is important to choose those most suitable to the project’s context and objectives. By considering thermal comfort, we are ensuring healthier, more sustainable, and pleasant environments for everyone.
I hope this article has provided a useful overview of thermal comfort metrics and tools. Keep exploring and deepening your knowledge in this fascinating field!


Your blog has really piqued my interest on this topic. Feel free to drop by my website UY8 about Thai-Massage.
What fabulous ideas you have concerning this subject! By the way, check out my website at 67U for content about Online Business.
You’ve written terrific content on this topic, which goes to show how knowledgable you are on this subject. I happen to cover about Content Writing on my personal blog UY4 and would appreciate some feedback. Thank you and keep posting good stuff!